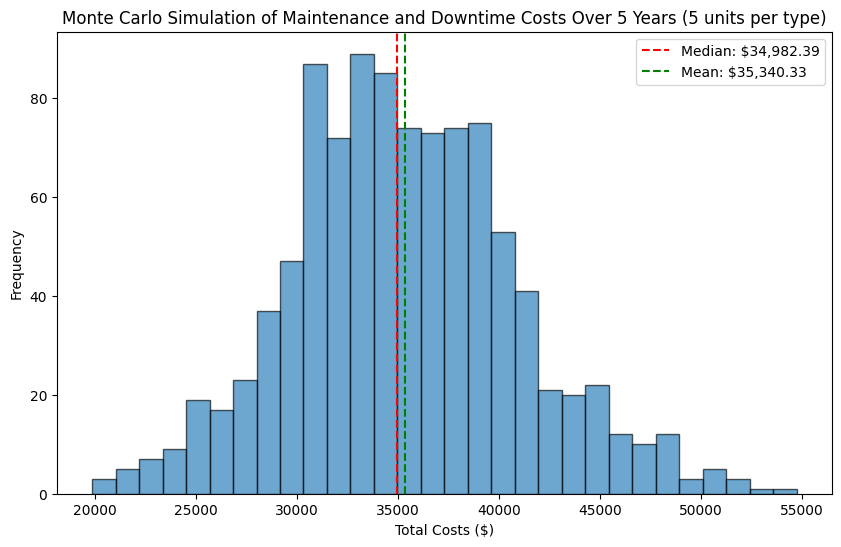
Monte Carlo Simulation (MCS) is a statistical technique to model uncertainty. Future is uncertain but you can predict this given the right data at hand. Businesses often use this technique to take various business decisions. For instance, industries use machine, machine’s failure can be predicted, cost associated for machine’s failure can be predicted, also cost associated with machine’s maintenance can be predicted. I keep saying predicted but the right term should be modeled and why, we will understand end of this article.

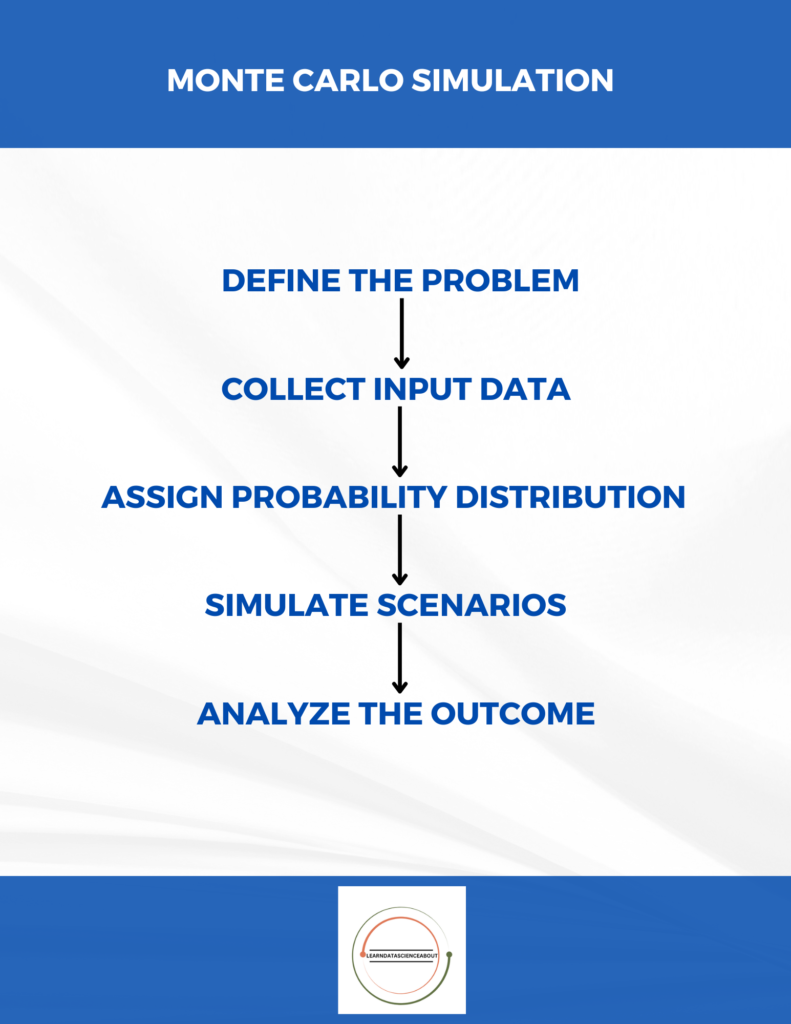
Learn these 5 steps to successfully design Monte Carlo Simulation!!
- First, define the problem such as Monte Carlo Simulation for Equipment Maintenance Costs.
- Second, collect data to build this simulation. All we need is failure data, cost data, environment data, distribution assumptions. Gather machine historical data that has mean time between machine failure (MTBF). Cost data can be divided into repair costs, downtime costs, preventive maintenance costs. Then, environmental data at which condition machines operated.
- Then, uncertain parameters need to be assigned with a probability distribution, such as failure times tend to follow exponential distribution, repair costs tend to follow normal distribution etc.
- Then, randomly sample data values from the assumed distribution for many times such as simulate for 10k times to get possible outputs of the uncertain scenarios from the future.
- Finally, analyze the results using metrics such as mean (e.g. average total cost to machine failure), percentiles etc.
import numpy as np
import matplotlib.pyplot as plt

# Equipment categories with different MTBF, repair costs, and downtime costs
equipment_types = [
    {"name": "Pump", "mtbf": 3, "repair_cost": 1200, "repair_volatility": 0.2, "downtime_cost": 500, "preventive_interval": 1.5},
    {"name": "Motor", "mtbf": 4, "repair_cost": 800, "repair_volatility": 0.15, "downtime_cost": 300, "preventive_interval": 2},
    {"name": "Valve", "mtbf": 2, "repair_cost": 500, "repair_volatility": 0.1, "downtime_cost": 200, "preventive_interval": 1}
]

num_simulations = 1000  # Number of simulations
years = 5  # Time horizon in years
num_equipment_per_type = 5  # Number of equipment units per type

# Function to simulate maintenance costs for a single piece of equipment
def simulate_maintenance(years, mtbf, mean_cost, cost_volatility, downtime_cost, preventive_interval):
    maintenance_costs = []
    downtime_costs = []
    current_time = 0

    while current_time < years:
        # Time to next failure (exponentially distributed based on MTBF)
        time_to_failure = np.random.exponential(mtbf)

        # Preventive maintenance check
        preventive_maintenance = preventive_interval if preventive_interval < time_to_failure else time_to_failure
        current_time += preventive_maintenance

        if current_time >= years:
            break

        if preventive_maintenance < time_to_failure:
            # Preventive maintenance (assume it costs 20% of the repair cost)
            repair_cost = 0.2 * mean_cost
            downtime = 0  # Preventive maintenance avoids downtime
        else:
            # Unplanned failure maintenance
            repair_cost = np.random.normal(mean_cost, cost_volatility * mean_cost)
            downtime = downtime_cost  # Downtime cost

        maintenance_costs.append(repair_cost)
        downtime_costs.append(downtime)

    return maintenance_costs, downtime_costs

# Run Monte Carlo simulations for all equipment types
total_costs_simulations = []

for _ in range(num_simulations):
    total_costs = 0
    for equipment in equipment_types:
        for _ in range(num_equipment_per_type):
            # Simulate maintenance and downtime costs for each piece of equipment
            maintenance_costs, downtime_costs = simulate_maintenance(
                years,
                equipment["mtbf"],
                equipment["repair_cost"],
                equipment["repair_volatility"],
                equipment["downtime_cost"],
                equipment["preventive_interval"]
            )
            total_costs += sum(maintenance_costs) + sum(downtime_costs)

    total_costs_simulations.append(total_costs)

# Convert to numpy array for analysis
total_costs_simulations = np.array(total_costs_simulations)

# Calculate mean, median, and percentiles
mean_total_costs = np.mean(total_costs_simulations)
median_total_costs = np.median(total_costs_simulations)
percentile_95 = np.percentile(total_costs_simulations, 95)
percentile_5 = np.percentile(total_costs_simulations, 5)

# Plot the simulation results
plt.figure(figsize=(10,6))
plt.hist(total_costs_simulations, bins=30, edgecolor='k', alpha=0.65)
plt.axvline(median_total_costs, color='r', linestyle='--', label=f'Median: ${median_total_costs:,.2f}')
plt.axvline(mean_total_costs, color='g', linestyle='--', label=f'Mean: ${mean_total_costs:,.2f}')
plt.title(f'Monte Carlo Simulation of Maintenance and Downtime Costs Over {years} Years ({num_equipment_per_type} units per type)')
plt.xlabel('Total Costs ($)')
plt.ylabel('Frequency')
plt.legend()
plt.show()

# Print the results
print(f"Projected total costs over {years} years (including downtime):")
print(f"Mean: ${mean_total_costs:,.2f}")
print(f"Median: ${median_total_costs:,.2f}")
print(f"95th Percentile: ${percentile_95:,.2f}")
print(f"5th Percentile: ${percentile_5:,.2f}")

Thank you for your help and this post. It’s been great.